


Table of contents

No headings in the article.
In the previous blog, we talked about Graylog and its important properties. We have also talked about how to install Graylog locally and get started.
Here is the link for that blog, https://saumyapandey.hashnode.dev/getting-started-with-graylog
In this blog, we will learn how can we send syslog from a Linux machine to a Graylog server.
I have already provided the details of installing Graylog in the previous blog so I will start by opening the dashboard in the browser.
Start the docker-compose file :
To access Graylog first start the docker-compose file using
docker-composeup ordocker-compose up -dAccessing Graylog Dashboard :
To access the Graylog dashboard go to your browser and enter the URL localhost:9000 . Once done there will be a prompt to enter a username and password like this.
Enter
adminas user-name and the default password will beyourpasswordor if you have changed the password while setting the .env file you can enter that password.Creating a new input :
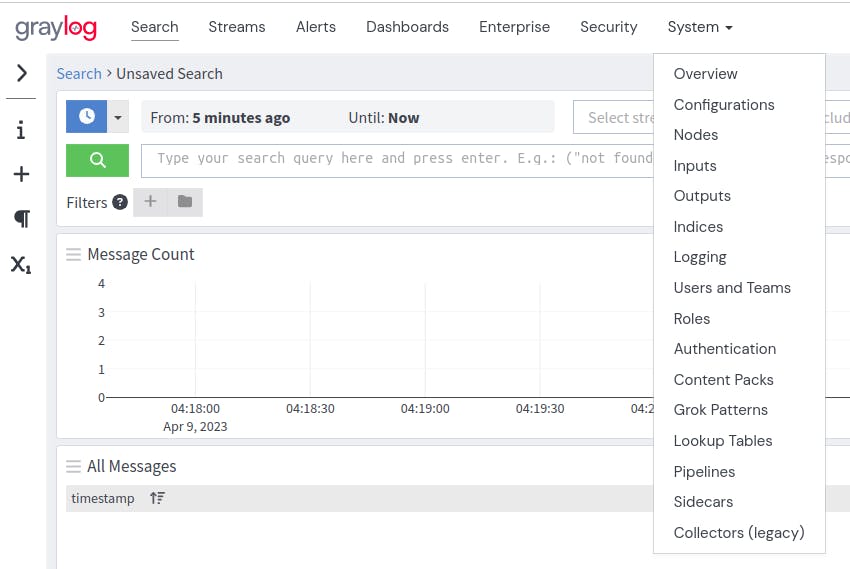
Once logged in You will land on Search page by default, if not you can move to this one which is pretty straight forward .

Then move to
Systemtab from the above tab, and selectInputsthere.
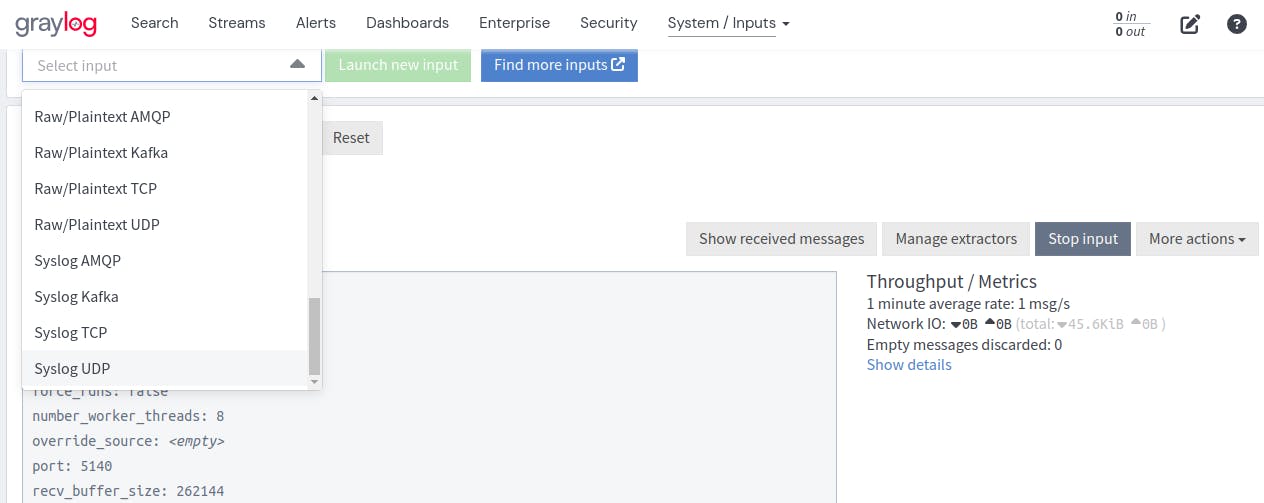
After selecting Inputs from the above list, you need to create a new input. Click on Select input option and then move to Syslog UDP and select it. And then Click on Launch new input. Currently, we are targeting UDP Syslog.
Launching a new Input
After clicking
Launch new Inputbutton you will get a prompt like this :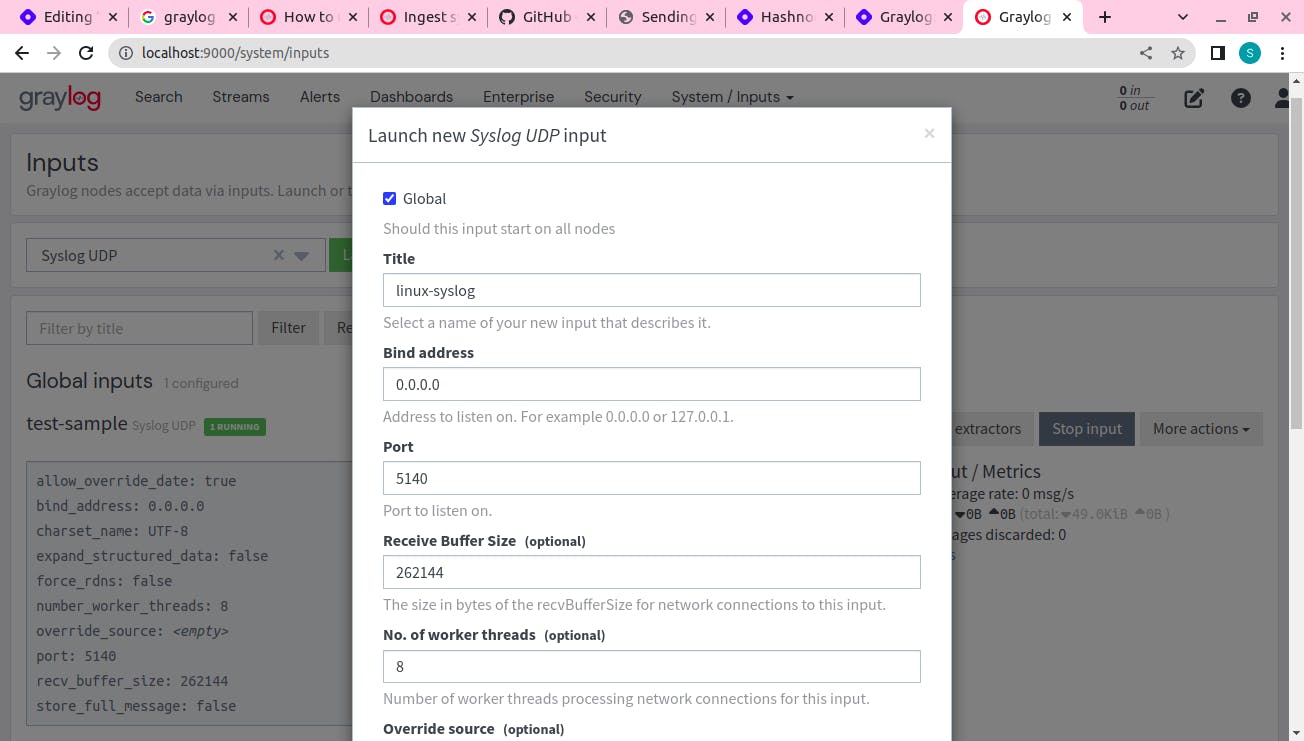
Here you need to check
Globalcheck boxThen you can fill the
Titleinput box for creating a name for your new input. I have named itlinux-syslog.By default Bind address will be
0.0.0.0. Leave it like that.Mention the Port number in
Portinput box. I have given it5140. You can check it in the docker-compose file, in the list of open ports. From the below image, you can see the list of open ports.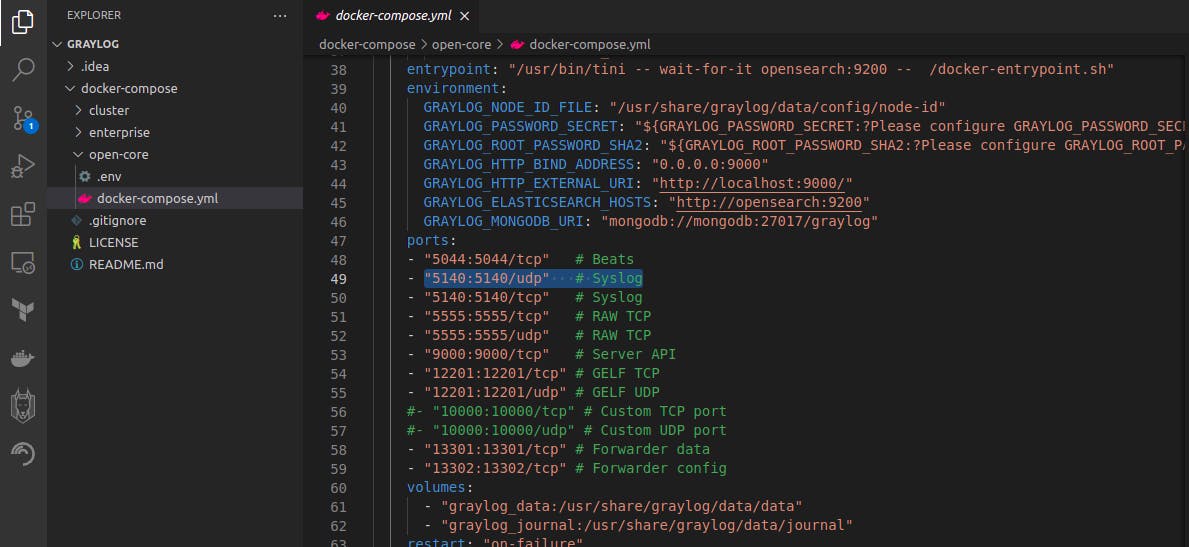
Then leave the rest of the inputs as it is and click on
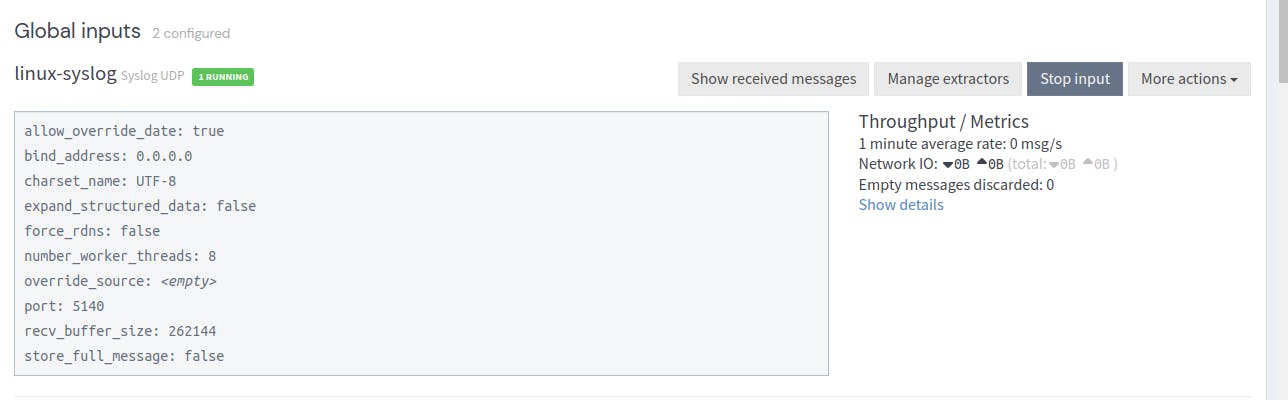
Launch inputat the end.You will see Linuz Syslog has been launched with
running statusunderGlobal inputs.
- Set up a .conf file for Graylog
Go to your terminal and create graylog.conf file under rsyslog.d folder

Add this line in your graylog.conf file and change the Ip-address with your Ip address. We are using port numbers as 5140 or UDP syslog.
*.*@172.16.10.51:5140;RSYSLOG_SyslogProtocol23Format
Let's break down this syslog forwarding configuration:
The first part "."represents the Syslog facility and severity levels that will be forwarded. In this case, the asterisk symbol (*) denotes that all facilities and severities will be included. This means that all log messages generated by the local system will be sent to the remote system.The "@" symbolindicates that the following string is the hostname or IP address of the remote system that will receive the forwarded logs."172.16.10.51"is the IP address of the remote system that will receive the logs.":5140"is the port number on the remote system where the Syslog messages will be received. In this case, port number 5140 is being used.";RSYSLOG_SyslogProtocol23Format"specifies the format of the syslog messages being sent. This is an optional parameter that is used to specify the Syslog protocol format. In this case, the RSYSLOG_SyslogProtocol23Format specifies that the syslog protocol version 23 format will be used. This format includes additional metadata such as the hostname, timestamp, and facility level, which can be used to better analyze the logs.
If you want to use TCP then change that line as below:
*.*@@172.16.10.51:5140;RSYSLOG_SyslogProtocol23Format
The difference between UDP and TCP is using @ instead of @@ as target descriptor.
Restart rsyslog service:
Finally, we need to restart rsyslog service:
systemctl restart rsyslog
We have finished the configuration on the Linux server. Now we can move to the Graylog server and check out our Search Page . We will be able to see logs popping up on our server.
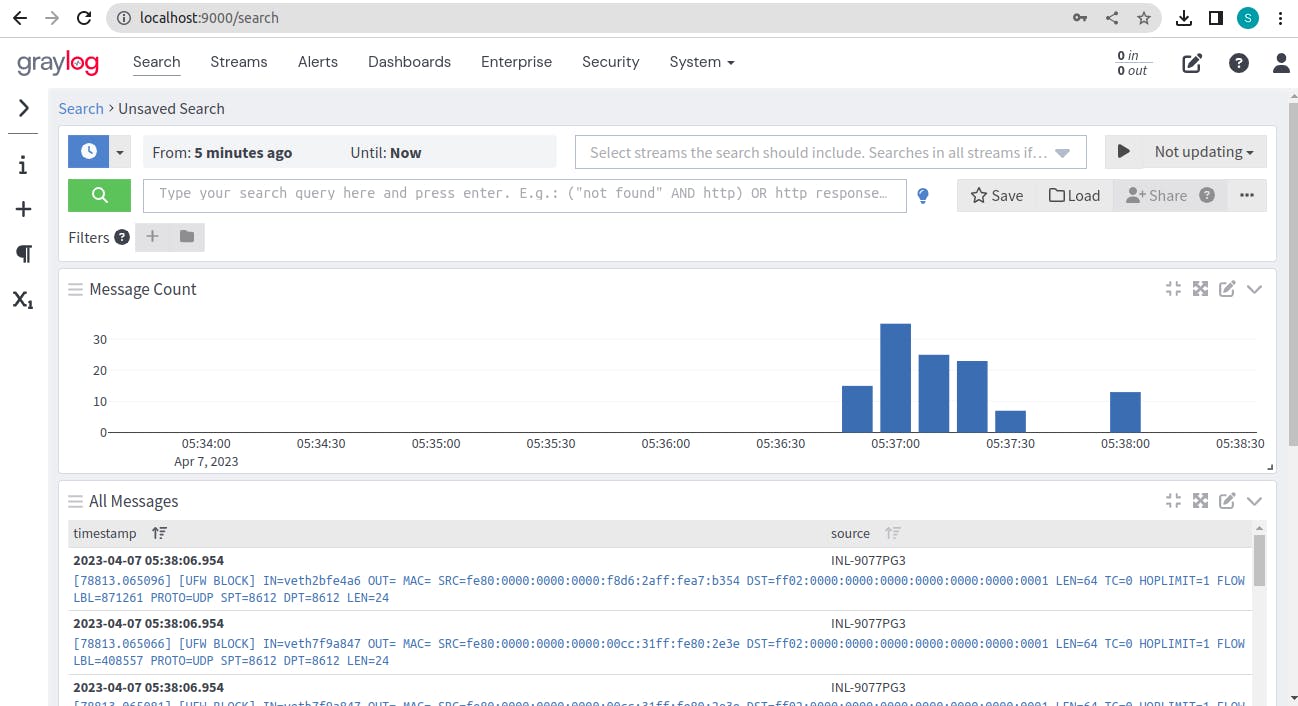
You can explore these dashboard logs and different options. That's all for this blog.
RESOURCES TO EXPLORE :